
The Producer Price Index (PPI) can be a valuable tool for businesses seeking to understand overall inflation, what is happening in markets of interest, as well as adjacent markets. The Bureau of Labor Statistics (BLS) publishes approximately 10,000 figures for individual products and groups of products each month that measure the average change over time in the selling prices received by domestic producers of goods and services, including paint and coatings manufacturers.1
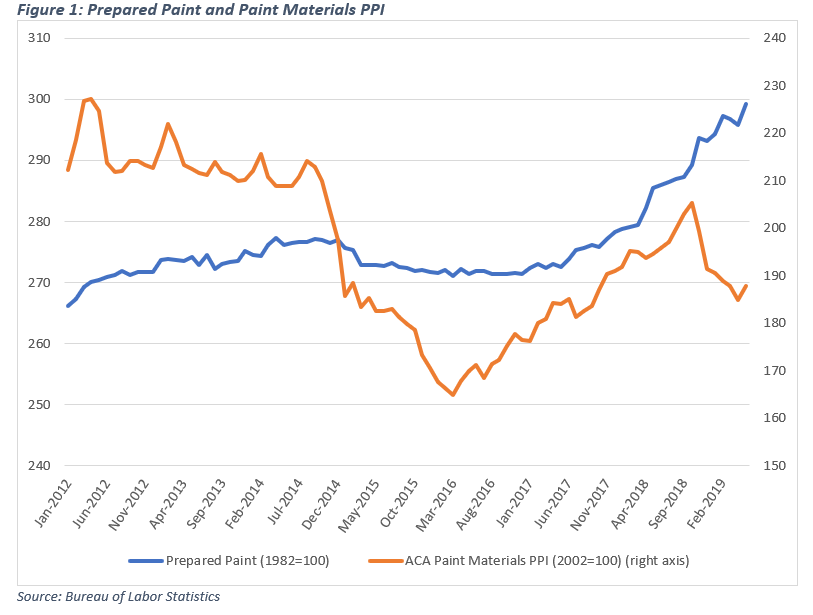
ACA regularly publishes two key PPI figures on a monthly basis. The first, “prepared paint,” is a broad overall measure of prices in the coatings industry overall as published by BLS. The second is a figure based on an ACA calculation of overall pricing movements of key raw materials used in coatings manufacturing.2 Looking at recent data shown in Figure 1, it appears prices of raw materials are relatively volatile, particularly as compared to “prepared paint,” which tends to show relatively little price volatility. NOTE: in this and the other charts below, the the data published for the four most recent months are preliminary and are subject to revision by BLS.
This relationship between raw material inputs and more finished goods is typical of cost movements by stage of production, as shown in Figure 2.

BLS provides additional detail on the coatings industry and publishes more granular data on various categories of coatings below the industry level. For example, there are index figures posted on the three major categories of coatings by end use, Architectural, OEM, and Special Purpose.3 As shown in Figure 3, OEM coatings have seen less inflation since the index year, although overall price tends over the past decade or so have been relatively consistent.


BLS also publishes additional detail available on various coatings segments, including Architectural, where the PPI data break out interior and exterior products, as shown in Figure 5. For comparison, a broad category of inputs to residential construction, of which architectural coatings are a component, shows that broad category as having greater pricing volatility, albeit directionally consistent.

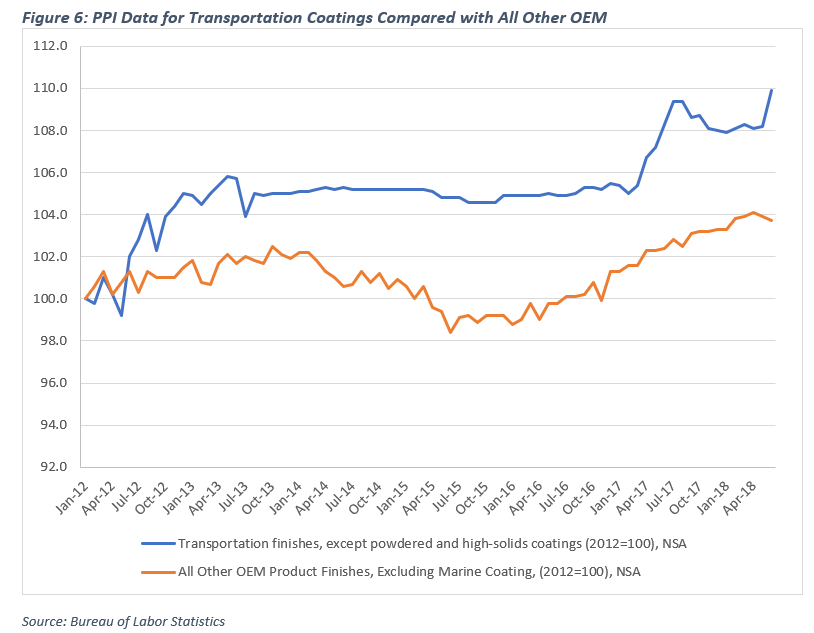
Similarly, BLS provides some more detailed data on the OEM category, where the data show that the transportation finish subcategory has seen somewhat more price appreciation than the remaining “all other” subcategory, as shown in Figure 6.
There is a wealth of additional detail available in the BLS database, accessible at https://www.bls.gov/ppi/.
Contact ACA’s Allen Irish for more information.
1] PPIs are available for the output of nearly all industries in the goods-producing sectors of the U.S. economy— mining, manufacturing, agriculture, fishing, and forestry— as well as natural gas, electricity, construction. The PPI program also covers approximately 72 percent of the service sector’s output. Unlike the Consumer Price Index (CPI), that measure price change from the purchaser’s perspective, the producer price index measures price change from the perspective of the seller.
2 This figure is derived according to a calculation developed by the ACA’s former Management Information Committee, and which utilizes as inputs a variety of PPI figures for key raw materials in proportion to their use by the industry.
3 BLS publishes some data at the “industry” level, corresponding to the North American Industrial Classification System (NAICS) structure, and other data that are organized by commodity. In the case of the coatings industry, the industry data and the commodity data are essentially the same and are interchangeable.
The post PPI Data Provide Insight into Industry Pricing Trends appeared first on American Coatings Association.
from American Coatings Association https://www.paint.org/ppi-june-19/
via IFTTT
No comments:
Post a Comment