
The Bureau of Economic Analysis (BEA) recently released prototype statistics for gross domestic product (GDP) by county for the period 2012-2015. Used in conjunction with other government statistical products, BEA’s county estimates of personal income, GDP by county offers a more complete picture of local area economic conditions.
These prototype GDP statistics, which provide detail for 3,113 counties in all states and the District of Columbia, include breakouts for private goods-producing industries, private services-producing industries, and a “government and government enterprises industry group.” County-level GDP statistics could provide additional guidance and insight to member companies who are looking to better understand economic activity at the county level and assist them in such things as identifying potential retail locations, or centers of growing industrial production that might drive demand for OEM coatings, etc.
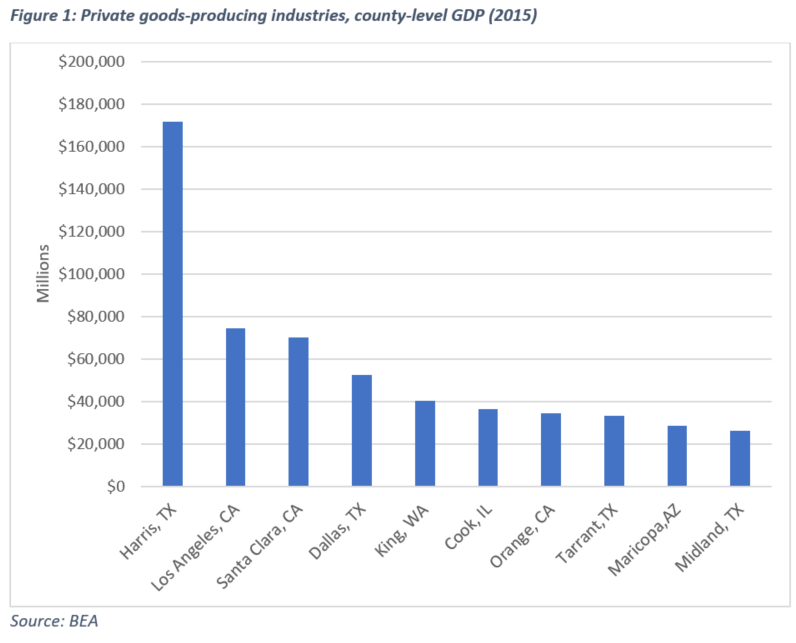
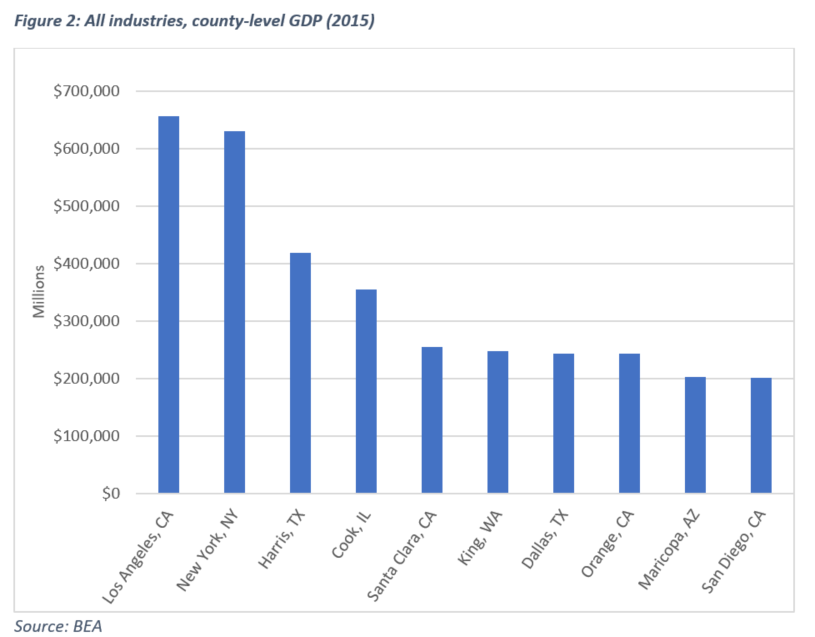
In drilling down into the data, users can identify the largest counties by GDP as well as by private industrial production, government services, and private service-producing industries. As shown in Figure 1, Los Angeles County, Calif. is the largest county in terms of total GDP,[1] while Harris County, Texas is the largest in terms of industrial production.[2]
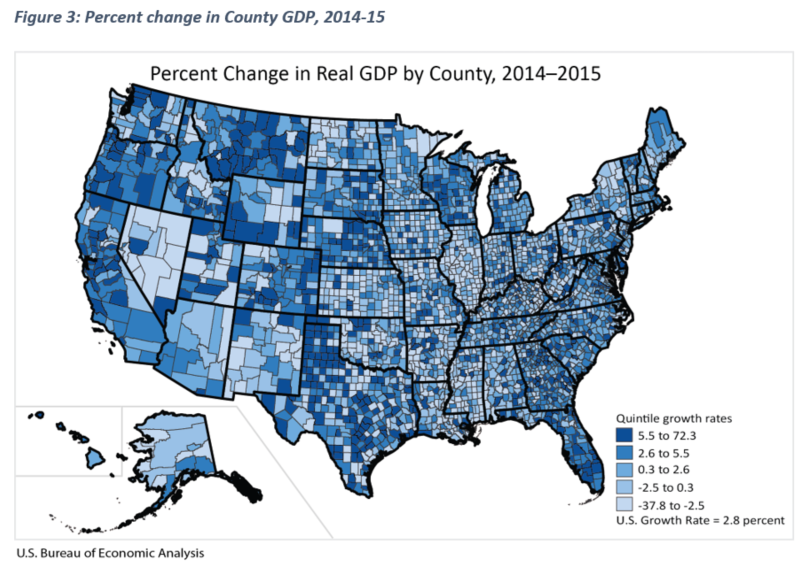
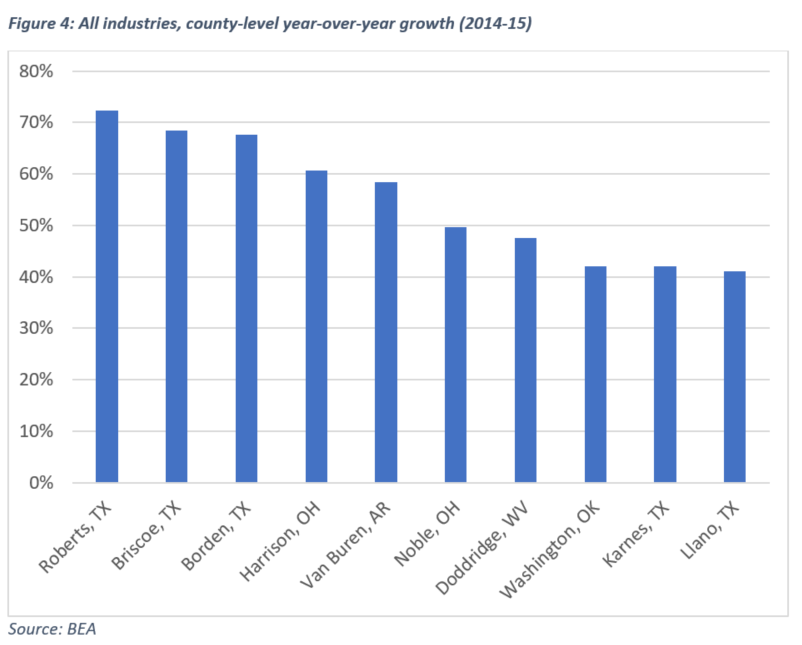
Looking at counties by year-over-year growth shows a very different picture, with small counties dominating that list. Roberts County, Texas was the fastest growing county level jurisdiction in the last measured period (2014-15), while four other counties in Texas made this list. Cameron Parish, La. had been the fastest growing jurisdiction in the previous period. Small counties, of course, can be heavily influenced by a single event, such as a new plant opening or expansion. For large counties, Denton County, Texas (12.2%) and Santa Clara County, Calif. (11.1%) had the largest increases in real GDP in 2015. BEA noted that growth in both counties was led by increases in private services-producing industries. A BEA map further illustrates county level growth across the county in the most recent period (2014-15).
To further explore these data, go to https://www.bea.gov/news/2018/prototype-gross-domestic-product-county-2012-2015. Detailed spreadsheets can be downloaded at the “Related Materials” tab.
[1] Note that New York City consists of five separate counties, which if aggregated, would comprise the largest jurisdiction by total GDP.
[2] Again, these data follow county jurisdictional lines, so large metro areas in which a single county dominates (such as Houston) will appear disproportionately large in comparison to metro areas in which a larger number of counties are significant parts of the metro area (e.g., Chicago). Users might want to aggregate data if interested in metro area performance.
Contact ACA’s Allen Irish for more information.
The post BEA Publishes First Series of County Level GDP Statistics appeared first on American Coatings Association.
from American Coatings Association https://www.paint.org/gdp-bea/
via IFTTT
No comments:
Post a Comment